KMX - F2Q26 - Auto industry flashing red?

Cheat Sheets presented by stocktwits
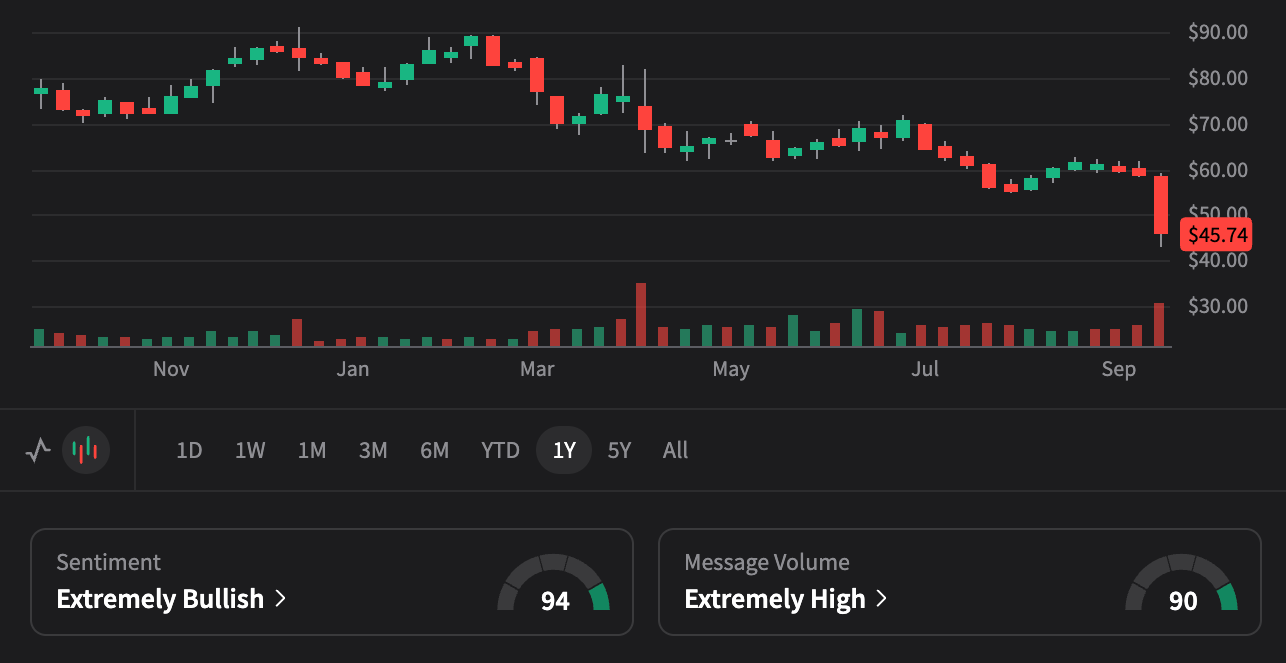
CarMax Investment Report - Q2 2026 Used Auto Market Leadership & Digital Transformation

CARMAX (KMX)

๐Ÿš—๐Ÿ’ป Nation's Largest Used Auto Retailer | Omni-Channel Experience

Q2 2026 Results | $6.6B Revenue, -6% YoY, Inventory Challenges Continue

๐Ÿ’ฐ Market Cap: $8.56B | ๐Ÿช Locations: 250+ | ๐Ÿ“‰ Revenue: -6% YoY ($6.6B)
๐Ÿ‘จโ€๐Ÿ’ผ CEO Bill Nash | ๐Ÿ“Š Used Unit Comps: -6.3% | ๐Ÿ’ณ CAF Penetration: 42.6%
$45.72
๐Ÿ“‰ -$11.33 (-19.86%) Today
Current Price
Price Target Scenarios

18-Month Horizon (2026 Targets)

$85.00
Bull Case (+86%)
Market Recovery
Digital Dominance
๐Ÿ“Š Valuation Calculation:
โ€ข 2026E Revenue: $28B ร— P/S: 0.45x = $85.00
๐Ÿš€ Key Assumptions:
Used auto market recovery โ€ข Same-store sales turn positive โ€ข Digital transformation success โ€ข "Wanna Drive?" campaign momentum โ€ข Inventory optimization โ€ข Market share expansion
$65.00
Base Case (+42%)
Gradual Stabilization
Industry Leader
๐Ÿ“Š Valuation Calculation:
โ€ข 2026E Revenue: $26B ร— P/S: 0.37x = $65.00
โš–๏ธ Key Assumptions:
Market conditions stabilize โ€ข Gradual same-store sales improvement โ€ข Cost management continues โ€ข Omni-channel advantage sustained โ€ข Auto finance growth
$35.00
Bear Case (-23%)
Market Disruption
Continued Decline
๐Ÿ“Š Valuation Calculation:
โ€ข 2026E Revenue: $22B ร— P/S: 0.24x = $35.00
๐Ÿ”ป Key Assumptions:
Same-store sales continue declining โ€ข Digital competitors gain share โ€ข Economic recession impacts โ€ข Interest rate pressure โ€ข Inventory depreciation accelerates
Bottom Line for Retail Investors
๐Ÿš—
Market Leader Position
Nation's largest used auto retailer, 250+ locations, omni-channel experience, 30+ years of brand trust
๐Ÿ’ป
Digital Transformation
"Wanna Drive?" campaign, seamless online/offline experience, customer-centric approach, inventory optimization
๐Ÿ’ฐ
Financial Resilience
CAF penetration 42.6% (+60bps), $900M securitization deal, $150M SG&A reduction plan, Sky 2.0 AI assistant rollout
โš ๏ธ
Market Headwinds
Same-store sales declining, inventory depreciation, competitive pressure, economic uncertainty impact

๐Ÿ“Š Q2 2026 "Fell Short of Expectations" Results

$6.6B Revenue, -6% YoY, $1,000 Inventory Depreciation Over One Month

๐Ÿ’ต
$6.6B
Q2 2026 Revenue
-6% YoY
๐Ÿ“Š
$0.64
EPS (Diluted)
vs $0.85 Prior Year
๐Ÿš—
-6.3%
Used Unit Comps
YoY Decline
๐Ÿ’ฐ
42.6%
CAF Penetration
+60bps YoY

๐Ÿ“ž Key Q2 2026 Earnings Highlights

๐Ÿ“‰
Inventory Depreciation
$1,000 depreciation over one month period, tariff speculation impact, inventory positioning challenges
๐Ÿช
Unit Sales Decline
Total retail units -5.4%, used unit comps -6.3%, each month weaker throughout quarter
๐Ÿ’ฐ
CAF Provision Hit
$142M loan loss provision, 2022-23 vintages struggling, additional $71M portfolio adjustment
๐Ÿ‘ฅ
Customer Traffic Issues
Web traffic up but conversion to selling opportunities down, high FICO customers sitting sidelines

๐Ÿ“ CEO Commentary: "While our second quarter results fell short of our expectations, we remain focused on driving sales, gaining market share" - Bill Nash

๐Ÿ’ก Strategic Priorities: $150M+ SG&A reductions over 18 months, additional $125 COGS savings on track, "Wanna Drive" campaign launch

๐Ÿ‘ฅ Customer Insights: High FICO customers (600+) sitting on sidelines, under $25k vehicles gaining share, 40% of inventory reserved at any time

๐Ÿ”ฎ Market Outlook: September stronger than Q2 months, Q3 GPU expected below record Q3 2025 levels, continued market share pursuit

๐Ÿ“Š Q2 2026 Performance & Key Metrics

MetricQ2 2026Performance
Revenue$6.6B-6% YoY
Total Gross Profit$718M-6% YoY
Retail GPU$2,216Historical Average
CAF Income$103M-$13M vs Prior Year
CAF Reserve Balance$507M3.02% of Receivables
SG&A Expenses$601M
Share Repurchases$180M
๐ŸŽฏ Management Commentary & Strategic Priorities
"Our second quarter results fell short of our expectations, we remain focused on driving sales, gaining market share, and delivering significant year-over-year earnings growth." - CEO Bill Nash. Key priorities: competitive pricing, "Wanna Drive" campaign, $150M+ SG&A reductions over 18 months, CAF penetration growth. CAF full-year income expected flat to slightly down vs. prior year guidance of growth. September performance stronger than Q2 months. 2024-25 CAF vintages meeting expectations while 2022-23 vintages required additional $71M provision adjustment.
๐Ÿš€ Why KMX Bulls Are Right
๐Ÿ‘‘
Market Leadership
Nation's largest used auto retailer, 250+ locations, 30+ year track record, Fortune 100 Best Companies to Work For
๐Ÿ’ป
Digital Innovation
"Wanna Drive?" campaign launched, Sky 2.0 AI assistant, record high NPS scores, omnichannel experience leadership
๐Ÿ’ฐ
Financial Strength
Strong balance sheet, auto finance arm growth, disciplined cost management, inventory optimization capabilities
๐Ÿ”„
Recovery Catalyst
Used auto market cyclical recovery, inventory repositioning, SG&A reduction program, operational leverage potential
๐Ÿป Why KMX Bears Have Valid Concerns
๐Ÿ“‰
Same-Store Decline
-7.1% YoY same-store sales, weakening each month sequentially, demand deterioration accelerating
๐Ÿ’ธ
Credit & Margin Pressure
$142M CAF provision, 2022-23 vintages struggling, inventory depreciation, margin compression, earnings shortfall
๐Ÿช
Digital Competition
Carvana, online competitors gaining share, changing consumer preferences, physical footprint disadvantage
๐ŸŒŠ
Market Headwinds
Economic uncertainty, consumer spending pressure, tariff impacts, interest rate environment challenges

This analysis is for informational purposes only and should not be considered investment advice. Please consult with a financial advisor before making investment decisions.